NASA Unveils Stunning Visualization of Global Carbon Dioxide Movement
The visualization, created using NASA’s advanced GEOS model, highlights the interconnectedness of the planet's atmosphere, revealing how CO2 emissions from different regions impact the entire world.

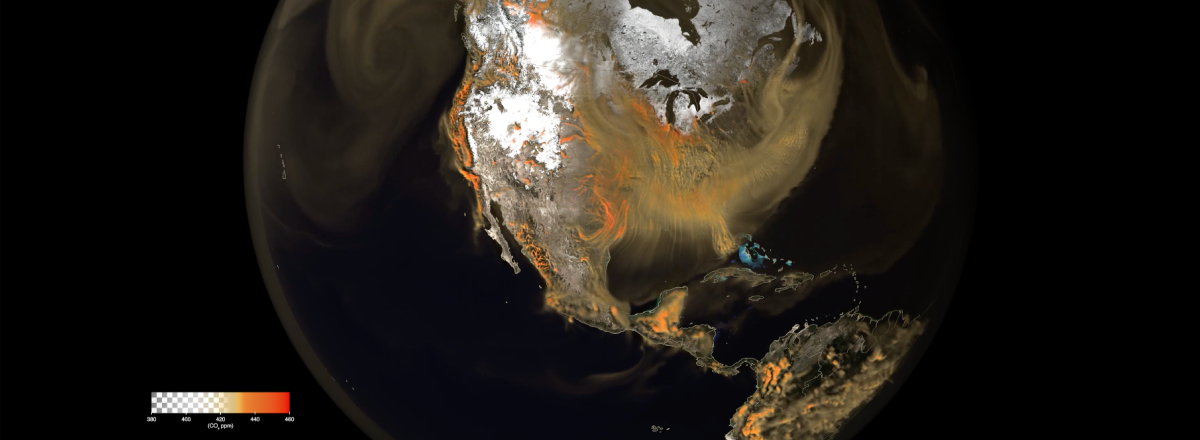
NASA has released a high-resolution video that vividly illustrates how carbon dioxide (CO2) spreads across the Earth's atmosphere, showcasing its journey from various emission sources to its global distribution by wind and weather patterns. The visualization, created using NASA’s advanced Goddard Earth Observing System (GEOS) model, highlights the interconnectedness of the planet's atmosphere, revealing how CO2 emissions from different regions impact the entire world.
The video captures CO2 emissions from January through March 2020, showing how the gas, emitted by power plants, vehicles, and wildfires, disperses across continents and oceans. Researchers from NASA emphasize that while the sources of CO2 may vary—ranging from industrial emissions in the United States, China, and South Asia to fires in Africa and South America—the effects are global, underscoring the collective challenge of addressing climate change.
One of the striking features of the visualization is the "pulsing" effect seen in the map. This effect is attributed to the daily cycles of CO2 absorption and release by plants during photosynthesis, as well as the influence of the Earth's planetary boundary layer, which fluctuates with the day-night cycle.
The GEOS model, powered by supercomputers and fed by billions of data points from satellite instruments and ground observations, offers a resolution over 100 times greater than typical weather models. This allows scientists to observe CO2 plume structures and their interactions with weather systems in unprecedented detail.
NASA’s climate scientists highlight the importance of understanding CO2 movement to address climate change effectively. The year 2023 was recorded as the hottest on record, a stark reminder of the urgent need to reduce greenhouse gas emissions. As CO2 levels in the atmosphere continue to rise, this visualization serves as a powerful tool to demonstrate the global impact of our carbon footprint and the critical need for international cooperation in combating climate change.